Contactless patient monitoring appeals to skilled nursing facilities, hospitals, and post-acute care settings because it offers distinct advantages for these patient populations: continuous vital sign data without wearables, cameras, or patient cooperation. However, not all radar-based systems capture the same detail.
A key factor often overlooked in evaluating systems is the radar frequency. Radar frequency directly affects the clarity of what’s measured. It’s the difference between getting a blurry snapshot or a high-resolution view of what’s happening with your patient.
Understanding how radar frequency affects measurement quality and why these differences matter can help you choose the right monitoring system for your needs.
A Quick Primer on Radar Frequency and Resolution
Radar works by emitting radio waves that bounce off a target and return to the sensor. In patient monitoring, the target is the human body. The frequency of these waves, measured in gigahertz (GHz), impacts how much detail the system can capture. Like a camera’s megapixels, the higher the radar frequency, the more detail that can be captured.
Lower-frequency radar systems can pick up bigger movements, like whether someone is breathing or moving in bed. Higher-frequency systems can detect not only breathing and movement but also finer physiological signals, such as micro-movements of the skin as blood pulses through the arteries.
There are trade-offs. Higher-frequency radar usually works at a shorter range. But in clinical environments where the sensor is mounted near a bed, chair, or recliner, range isn’t usually the limiting factor. Resolution is what lets you see not just if someone is breathing, but how they’re breathing.
Getting the Full Picture on Radar Capture Quality
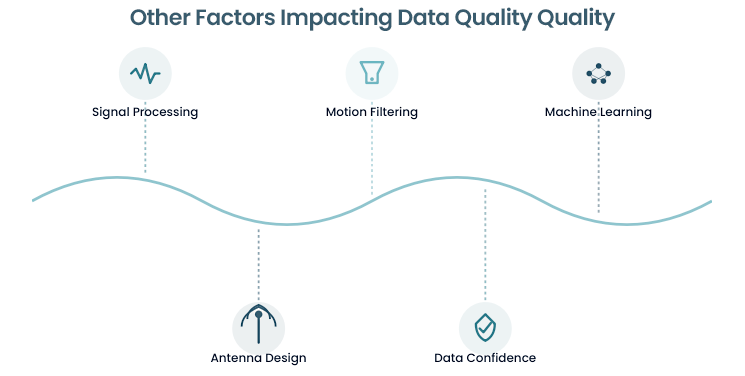
Signal processing, antenna design, motion filtering, and machine learning models all help turn radar measurements into useful clinical data. But just like a camera’s megapixels, radar frequency sets the maximum possible detail that can be captured.
Radar-based patient monitoring systems on the market today generally fall into three frequency categories:
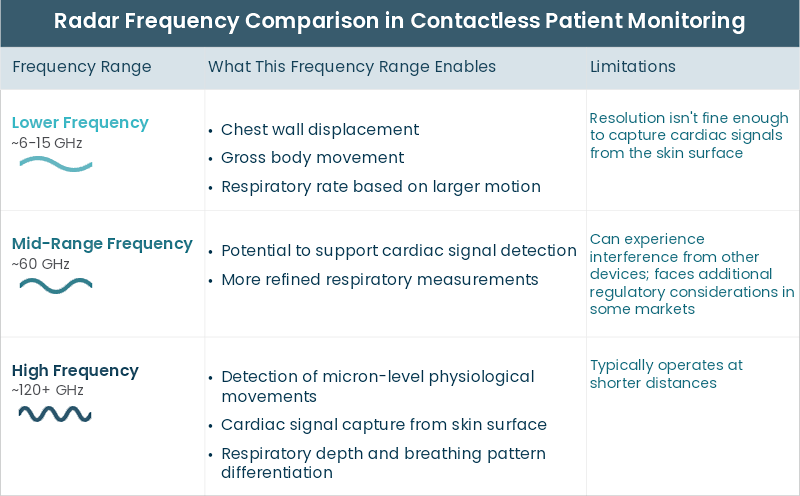
Ultra-Wideband (UWB) Systems (~6–15 GHz)
These systems use lower frequencies, which give them a longer range and good visibility through materials. They can reliably detect large body movements and respiratory rate based on chest wall motion. However, the resolution at these frequencies isn’t fine enough to capture cardiac information from the skin’s surface. Some require the patient to be still for a period of time before reporting a measurement. The data you get is basic: presence, movement, and respiratory rate.
Mid-Range Systems (~60 GHz)
Stepping up in frequency improves resolution. However, this frequency band can be affected by interference from other devices and environmental factors, such as humidity. It’s a middle ground, offering more detail than UWB, but still can’t see fine cardiac waveforms.
High-Frequency Systems (~120+ GHz)
At 120 GHz and higher, the picture gets significantly sharper. Systems at this frequency can measure changes as small as one-tenth of a micron. That’s fine enough to detect the tiny skin movement from a pulse wave, which is the same thing you feel when you check your pulse on your wrist or neck.
This level of fidelity enables continuous measurement of heart rate, respiration rate and depth, and inhale-to-exhale ratio. For example, the Neteera System operates at approximately 122 GHz, delivering high-precision measurements in real time every one to two seconds, without needing the patient to stay still first.
A system running at 122 GHz can detect smaller physiological movements than one at 24 GHz. The downside is that higher-frequency systems usually have a shorter range. But in clinical settings where sensors are mounted near beds or chairs, range isn’t usually the limiting factor. Resolution is.
Why Bringing Details into Focus Matters for Clinical Decisions
In skilled nursing facilities managing higher-acuity residents, or in hospital units where meeting clinical response obligations is paramount, monitoring data often shapes downstream decisions. Knowing a patient is breathing is just the starting point, not the finish line.
Heart rate, respiratory rate, and respiratory depth can provide early signals that help clinical teams intervene sooner, rather than reacting later. But to capture these warning signs, you need frequency resolution to measure micro-level movements and strong signal processing to turn them into reliable clinical data.
Resolution Affects Data Confidence
Higher frequency resolution doesn’t just provide more data; it provides more reliable data. Systems that measure more precisely can set stricter standards for data quality. If the signal-to-noise ratio drops (because a patient is moving, for instance), a high-fidelity system can flag the data as not meeting its confidence threshold rather than reporting a questionable value.
This is very important for managing alerts. Too many false alarms can quickly make staff lose trust in any monitoring system. A system that only reports data when it’s confident gives clinical teams a much better foundation for trust.
Beyond Radar Frequency: Other Impacts on Monitoring Data Clarity
When evaluating contactless monitoring systems, frequency is one factor among several that determine data quality:
Signal-processing algorithms: This is often where a manufacturer adds their unique value, turning raw radar signals into clinically meaningful measurements, trends, and insights. Two systems using the same frequency can give vastly different results depending on their algorithms.
Antenna design: Antenna type, array configuration, and directional capability affect how well a system can focus on a patient and filter out environmental interference.
Motion filtering: This determines whether the system can separate respiratory and cardiac signals from patient movement, such as shifting position, fidgeting, or getting out of bed.
Data confidence thresholds: Systems that set measurement confidence standards and withhold readings if signal quality is questionable help clinical teams trust the data and reduce alert fatigue.
Machine learning models: These models enable the system to recognize individual patient patterns, adapt detection thresholds over time, and identify subtle indications of deterioration before they become critical events.
Radar frequency is the foundation for these other factors and is key to the clinical value of your patient monitoring data.
Ask About Frequency When Evaluating Contactless Monitoring Systems
Contactless, radar-based technology is a broadening category. The terms “contactless” and “radar-based” help identify patient vital sign monitoring that removes barriers to patient compliance. But these labels don’t tell you what a system actually measures or how much clinical detail it provides.
When evaluating radar-based patient monitoring for your facility, the frequency question is worth asking early. Radar frequency sets the boundary on what’s measurable, and frames everything downstream: what vital signs you can track, how granular the data is, how much confidence you can place in each reading, and ultimately whether your care team has the information it needs to act before a patient’s condition deteriorates.
Today’s technology can do much more than just detect presence or basic breathing rates. The real question is whether the system you’re looking at is built to show the full clinical picture or just a small part of it.