


Continuous data adds a second piece: timing. Exits clustered around the same hour most nights? That’s often a toileting pattern, and a schedule fix. Exits scattered with no pattern? That points to something else, possibly disorientation or discomfort, worth mentioning at the next care plan review.
In either case, the team now has information they can act on, instead of relying on what someone remembers from Tuesday’s shift.
Restlessness: An Earlier, More Objective Read on Sundowning
Estimates for sundowning prevalence vary widely, from 1.6% to 66%, largely because studies define and measure it differently, including differences in diagnostic criteria, assessment methods, and the populations studied. But whatever the exact number, disrupted sleep is one of the factors researchers consistently point to as a contributor.
The problem with catching it at the bedside is that sundowning starts small. Initial symptoms are usually mild and easy to write off as a bad day. If it’s obvious enough for staff to flag, it’s already escalated.
Movement data can help surface the signs of sundowning earlier. That same research notes that actigraphy, a non-invasive way to track a patient’s rest and activity patterns over time, can flag irregular activity patterns that may be precursors to a behavioral event. Tracking a resident’s restlessness over their own week, rather than by shift, can show the drift before it escalates.
Catch it there, and the team has other options to consider first, like an adjusted evening routine or a lighting change, which CMS’s updated guidance now specifically expects facilities to document before turning to psychotropic medication.
In long-term care specifically, sleep disturbance has been linked to a range of downstream effects, including increased agitation and greater fall risk. And there’s a real gap between what staff observes and what’s actually happening. Nursing home staff have been shown to significantly underreport sleep problems compared to objective measurement.
Residents can’t always tell you something feels off, and staff can’t watch around the clock. Continuous data closes that gap. “She seemed restless last night” becomes a trend the team can actually plan around.
Closing the Overnight Gap in Care Plan Reviews
CMS already requires skilled nursing facilities to involve families in care planning when the resident consents. These reviews already cover a lot: health status, recent falls, medication changes, progress toward rehabilitation or functional goals, dietary needs, and discharge planning. What’s harder to bring to that discussion is a clear picture of what happens overnight, when no one on the interdisciplinary team is in the room.
Overnight is the one part of a resident’s day that families never see firsthand: no visiting hours, no shift they’re present for. That’s not a gap in how the team runs the conference. It’s a structural gap in what anyone, family or staff, can observe directly between rounds. A resident-specific, night-by-night sleep report fills exactly that gap
Neteera’s HealthGate Sleep Report is one example of what that looks like in practice. Generated for any 7-night window, it shows a resident’s Sleep Score, duration, efficiency, bed exits, movement, and average nighttime heart and respiratory rates, night by night, against that resident’s own baseline.
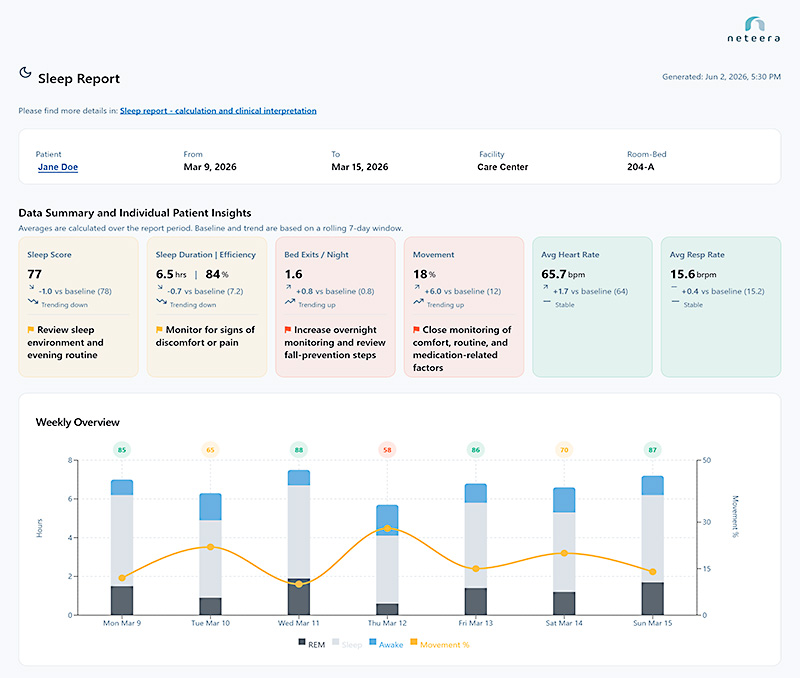
Illustrative sample from the Neteera HealthGate Sleep Report, shown with fictional resident data for demonstration purposes.
A heatmap shows when sleep, movement, and out-of-bed events happened overnight, so the team can see whether a pattern is clustered at a specific hour or spread across the night. REM sleep percentage rounds out the picture separately, as a nightly and weekly total, rather than a timestamped view of the night.
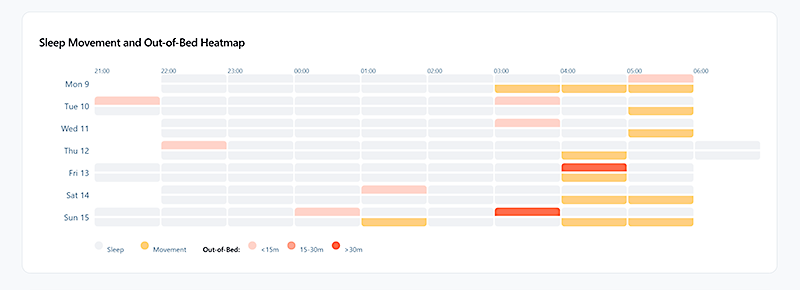
Illustrative heatmap from the Neteera HealthGate Sleep Report, showing overnight sleep, movement, and out-of-bed timing for a fictional resident.
Each metric in the report also includes a short note when it moves outside of that resident’s baseline. For example, flagging that a rising bed-exit count may be worth a closer look, or that a dip in sleep score points to a review of the evening routine. It’s not a diagnosis. It’s a prompt for where the team might look first, instead of scanning six numbers and guessing which one matters tonight.
Adding this data to the conference doesn’t change what the team already covers. It adds more concrete data points to reference alongside the rest of the agenda, including which nights were harder, whether there are options to consider, and what the team is watching going forward.
Families get a clearer picture of what’s hard to observe overnight, and the care team has one more insight to bring to a conversation that’s already comprehensive.
A week of data doesn’t replace clinical judgment. It gives the team a place to start, and gives families something real to hold onto.
What Sleep Monitoring Changes for Skilled Nursing Teams
When sleep monitoring is added to the care plan, tracking bed exits and restlessness can help answer family questions and support care decisions.
Data replaces guesswork. Instead of wondering whether last night was unusual, the care team already knows. “We’re keeping an eye on her” becomes “Here’s what we saw.”